/// FIELD NOTES FROM A SELF-AWARE GAME SITE
GPU Overclocking 2026: 12 Steps, +15% Power, 60 Min
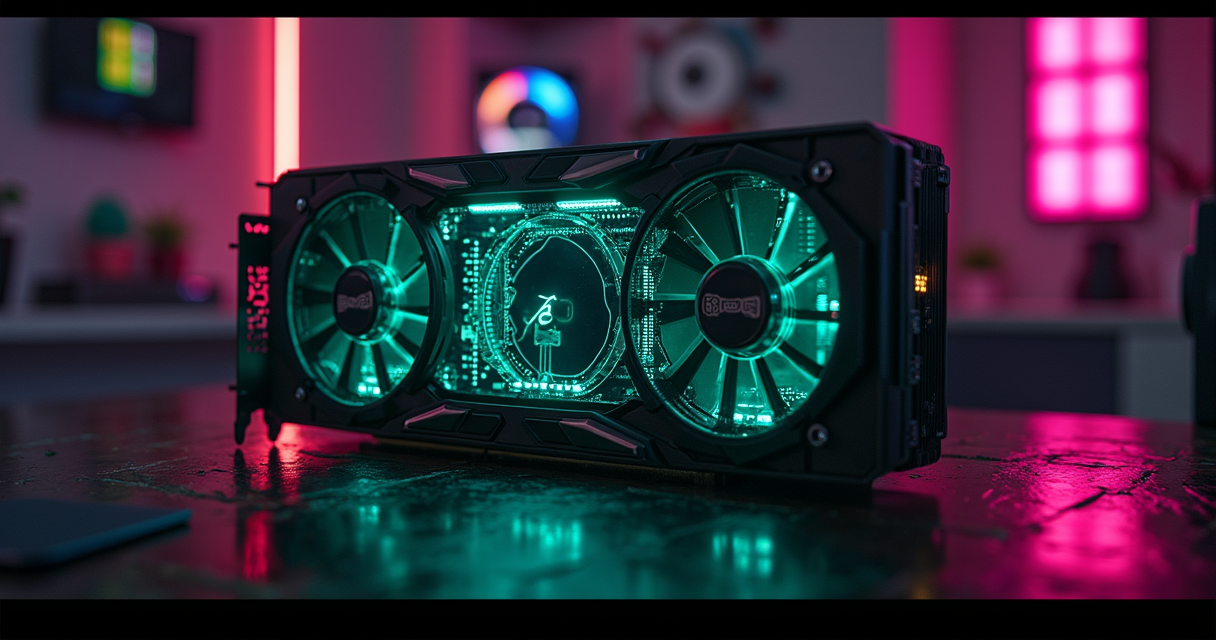
Nobody overclocks a graphics card for the benchmark. You overclock for the workload the benchmark stands in for — and on a retro site, that workload is not the latest DOOM. It is RPCS3 rendering Demon's Souls at native 4K, PCSX2 pushing a PS2 disc through an 8× internal-resolution multiplier, Cemu upscaling Wii U output well past anything Nintendo shipped, and a stack of guest-advanced CRT shaders doing multi-pass mask, scanline, and phosphor math on every single frame. Emulation is the polite hobby that turns, without warning, into one of the most GPU-bound things on your SSD the moment you decide 240p is beneath you.
Which is why free performance is worth chasing here more than almost anywhere. A stable overclock is the difference between a locked 60 fps in a shader-heavy preset and a stutter every time the emulator hits a busy scene. But free is carrying a great deal of weight in that sentence, and this guide is mostly about the fine print. Overclocking in 2026 is not a slider party. It is a measurement process with three hard ceilings — power, temperature, and voltage — and a payoff that lands in the single digits to low double digits, not a free upgrade to the next tier.
We will do this in twelve numbered steps using MSI Afterburner, still the default consumer tuning UI even when your GPU vendor ships its own. We raise the power limit first, nudge the core clock in +15 MHz steps, find the memory sweet spot by watching the score rather than the screen, and lock the result so it survives a reboot. Budget an hour if you are careful, a weekend if you are thorough. Start with why any of this works at all.
Free FPS, With an Asterisk
Current consumer guides all frame GPU overclocking the same way: free performance optimization rather than hardware modification. That framing is correct, and it is also where people get themselves into trouble, because “free” quietly assumes you have thermal and power headroom that varies by card, by vendor, and by the specific piece of silicon on your desk. There is no universal safe setting. There is only your card's safe setting, which you find by measuring.
The retro case for overclocking
If you only ever ran games at their native era resolution, you would never need this article; a 15-year-old GPU brute-forces a PS1 title. The load appears when you upscale. Push PCSX2 to 6× or 8× internal resolution and you are asking the GPU to draw a PlayStation 2 scene at more pixels than the console had memory to imagine. Stack RetroArch's heavier CRT shader chains — the multi-pass presets documented in the libretro docs — and every frame runs a fragment program that samples, blurs, masks, and recombines the image several times over. RPCS3 and Cemu are worse still: real 3D at native 4K with anisotropic filtering forced on. These are genuinely GPU-bound workloads, and a 6-10% overclock is often exactly the margin that turns a 54 fps average into a locked 60.
Overclocking is a measurement process
The single most useful mental shift is to stop thinking of overclocking as “turning things up” and start thinking of it as instrumenting a system and reading the dials. A 2026 guide's advice to record baseline benchmark data before you change anything — peak GPU temperature, peak power draw, and a score such as 3DMark Time Spy — is not busywork. It is the control group. Without a before number, your after number means nothing, and you have no way to catch the most insidious failure mode in the whole hobby: an overclock that runs perfectly stable while quietly making the card slower. More on that when we get to memory.
What “safe” means in 2026
Safe is contextual. One 2026 source advises staying below 85-90°C for most cards; another builds a fan curve that hits 100% fan speed at 85°C. Both are defensible because the number that matters depends on your card's cooler, your case airflow, and whether you are looking at the GPU core temperature or the memory-junction and hotspot sensors that run considerably hotter. The good news is that a software overclock cannot physically destroy a modern card the way a careless one could in 2008; the power and thermal limiters intervene first. The bad news is that they intervene by throttling or resetting the driver, which looks like instability and sends beginners chasing the wrong variable. Knowing which ceiling you hit — power, temperature, or voltage — is the entire skill.
How Your GPU Already Overclocks Itself
Before you move a slider, understand that your card has been overclocking itself since the day you installed it. Every modern GPU ships with a dynamic boost algorithm — NVIDIA calls it GPU Boost, AMD has its own equivalent in RDNA — that constantly raises clocks above the advertised base figure until it bumps into a limit. Your manual overclock does not set the clock. It moves the ceiling the boost algorithm is allowed to climb toward.
The slider is a request, not a command
This is the detail that confuses newcomers. When you dial +150 MHz into Afterburner's core clock, you are not commanding 150 extra megahertz. You are adding an offset to the entire voltage-frequency curve. The card still decides, moment to moment, how high it will actually clock based on how much power and thermal budget it has left. That is why two people with the identical card and the identical +150 offset can see different sustained clocks: one has better cooling and rides the offset all the way up, the other hits the temperature limit and the boost algorithm claws the clock back down. The offset is a suggestion the silicon is free to ignore.
Three ceilings: power, temperature, voltage
A boost algorithm throttles the instant it touches any one of three limits. Power: the card has a board power budget (NVIDIA's TGP, AMD's total board power) and will not exceed it, which is why several 2026 guides tell you to raise the power limit first — often +15% for NVIDIA and +12% for AMD in one guide, or simply the maximum the slider allows. Temperature: cross the thermal limit (frequently 83-88°C on the core, higher on the hotspot) and clocks drop to protect the die. Voltage: the card will not feed the core more voltage than its VBIOS permits, and consumer cards expose only a sliver of that range. Raise the power ceiling and the temperature ceiling and you let the boost algorithm sustain higher clocks for longer; that alone, before you touch the core offset, can be worth a few percent.
Why the same card overclocks differently
Silicon lottery is real and it is not marketing. Two dies cut from the same wafer leak current and tolerate voltage slightly differently, so one Blackwell RTX 5080 might hold +200 MHz on the core while its identical twin artifacts at +160. This is why every number in this guide is a starting target to validate, never a guarantee. It is also why copying someone else's exact offset off a forum is the fastest route to a mysterious crash three hours into Baldur's Gate 3: their card is not your card. The method transfers. The numbers do not.
Prerequisites: Versions and Hardware
Overclocking with the wrong tools or on the wrong hardware is how a free afternoon becomes a driver reinstall. Get these in order first. Versions matter in 2026 more than usual, because two of the most-recommended tools have a stable release and a beta release circulating under confusingly close version numbers.
Software, with exact versions
- MSI Afterburner 4.6.6 — the stable build (4.6.6.16757), the first stable release in roughly two years, with RTX 50-series support, unofficial Radeon RX 9000 support, and RivaTuner Statistics Server 7.3.7 bundled. This is the one you want. The 4.6.7 build floating around is still Beta 3 (build 17352, roughly April 2026); it adds a better V/F curve editor but it is pre-release, and some betas carry an expiry date. Download from the MSI site or Guru3D only. Mirrors that repackage the installer are a known malware vector.
- Current graphics driver — on NVIDIA that is the 610.x branch (610.74 WHQL as of early July 2026). Note that driver 610.47 (late May 2026) removed the classic NVIDIA Control Panel entirely; tuning now lives in the NVIDIA App. AMD users want a current Adrenalin package.
- Stress and benchmark tools — Unigine Superposition (free basic edition), FurMark 2.10.2, 3DMark Time Spy, and OCCT for its dedicated VRAM error test. Real games are the final exam; synthetics are the practice test.
- Monitoring — GPU-Z or HWiNFO for a sensor log, plus Afterburner's own on-screen display so you can watch clock, temperature, and power without alt-tabbing.
Hardware and thermal reality
Three hardware truths decide whether overclocking is worth it for you. First, power supply headroom: overclocking raises transient power spikes, and a PSU running near its rated limit can shut the whole machine off under a FurMark load even when average draw looks fine. If a $3,000 RTX 5090 is already asking for 575W, adding +15% power limit is not something a marginal 650W unit will tolerate. Second, airflow: overclocking is a thermal problem wearing a performance costume, and a card starved of case airflow will throttle away your gains before you finish the first benchmark. Third, physical mounting — a heavy triple-slot card sagging in its slot can stress the PCIe connection and the cooler mount; fix that before you add heat. And laptops are their own category: a mobile GPU sharing a heat pipe with the CPU is thermally and power-bound from the factory, and the honest answer there is usually to undervolt for efficiency rather than chase clocks.
Back up, and know your undo button
Afterburner's undo button is the Reset icon, which zeroes every offset instantly, and a reboot wipes any software overclock that you did not explicitly set to apply at startup. That reversibility is your safety net — software overclocking is non-destructive by design. Before you begin, note your card's stock behavior so you can recognize when something has changed for the worse, and if you plan to touch the VBIOS later (we will get there), back up the original ROM with GPU-Z first. The one thing you cannot easily undo is a bad flash, so keep that firmly in the advanced section where it belongs.
The 12-Step Overclock
Here is the whole procedure. The order is not arbitrary: you establish a baseline, then raise the ceilings, then push the core, then push the memory, then validate and lock. Every step has a reason, because a step you do not understand is a step you will skip at exactly the wrong moment.
Steps 1-4: Baseline and headroom
- Record your baseline. Before touching a slider, loop Superposition or run Time Spy and write down three numbers: peak GPU temperature, peak power draw, and the score. This is your control group; every later change is measured against it. A baseline log looks like this:
=== BASELINE @ stock — record before you touch anything === # numbers show the SHAPE of a good log; yours will differ GPU : GeForce RTX 5070 (driver 610.74 WHQL) Test : Unigine Superposition, 1080p Extreme (looped) Peak temp : 71 C (this is your thermal headroom) Peak power : 248 W (~100% of a ~250W TGP = your power headroom) Peak core : 2560 MHz boost Score : 8,640 (illustrative — write YOUR numbers down) - Open Afterburner and unlock voltage. In Settings → General, tick Unlock voltage control and Unlock voltage monitoring. Many cards expose limited voltage control, so what you can actually adjust depends on your GPU and its VBIOS — but you cannot monitor what you have not unlocked, and you want the readout even if you never move the voltage slider.
- Raise the power limit first. Drag Power Limit to its maximum, or to a deliberate target such as +15% on NVIDIA. Because boost is power-gated, this alone lets the card sustain higher stock clocks; it is also the change that “does not practically hurt as long as it is properly cooled.” If temperature limit is a separate, unlinked slider, raise it too.
- Re-benchmark at raised limits, still stock clocks. Run the same loop again. You will often see a small score bump from headroom alone, and now you know how much of your final gain came from the ceilings versus the clocks. This is the measurement discipline paying off already.
Steps 5-8: Core clock
- Raise the core clock in small steps. Add +15 MHz to the core clock offset and apply. Beginner guides converge on +10 to +25 MHz per cycle for a reason: large jumps skip straight past the last stable point and tell you nothing about where it was. Tom's Hardware runs +15 MHz steps; that is the sweet spot between speed and precision.
- Stress-test after every step. Run a short loop — 10 minutes is the quick screen, 20-30 minutes is moderate, 60 minutes is confidence. Watch for artifacts, crashes, driver resets, and score. If it passes clean, go back to step 5 and add another +15 MHz.
- Push until it breaks, then note where. Keep climbing until you get a crash, a black-screen driver reset, or visual artifacts. That is the ceiling. A passing Superposition run at a good overclock looks like this:
Superposition 1080p Extreme — OC pass (core +150, mem +1200 eff) Min FPS : 58.9 Avg FPS : 74.2 Score : 9,470 (+9.6% vs baseline 8,640) GPU temp : 76 C max Result : PASS — no artifacts, no reset, score UP -> keep going - Back off one increment for the daily-stable clock. Whatever offset first crashed, drop back 15-30 MHz below it. The last value that survived a full-length test is your stable core clock, not the highest value that booted. Enthusiasts call this the “last stable” overclock, and instability — crashes, artifacts, resets, or falling scores — is always the stopping point, not a challenge to push through.
Steps 9-12: Memory, cooling, and lock-in
- Now tune memory, watching the score. With the core locked, raise the memory clock gradually — larger steps are tolerable here, say +100 to +200 MHz effective — and retest. This is the trap: GDDR does not artifact first, it slows first. If the score stops climbing and starts to fall, you have passed the sweet spot; the card is spending cycles correcting memory errors. Back off to the last clock where the score actually improved. (Full explanation in the next section — it is the most misunderstood part of the whole process.)
- Set a custom fan curve. Trade a little noise for a lot of stability. A common aggressive curve ramps to 100% fan speed by 85°C so the card never reaches the thermal limit under sustained load:
Emulation sessions are long and steady-state, so a curve that keeps the die comfortably under its throttle point matters more here than in a bursty AAA title.Temp (C): 40 55 65 75 80 85 Fan (%) : 30 40 55 75 90 100 - Validate with the real workload. Synthetics find gross instability; your actual games find the subtle kind. Run an hour of the thing you actually overclocked for — RPCS3 at 4K, PCSX2 at 8×, your heaviest shader preset — because “stable in Superposition” and “stable in the emulator you use nightly” are not the same claim. A driver reset in hour two means back off one more increment.
- Save the profile and apply at startup. Store the validated result to one of Afterburner's profile slots (1-5) and enable Apply overclocking at system startup so it survives a reboot. Persistence is a practical concern that people forget until their overclock silently vanishes after a Windows update. Save it, and confirm it reloads after a restart.
One-Click Tuning: NVIDIA App vs Adrenalin
Not everyone wants to babysit twelve steps, and in 2026 both GPU vendors ship a built-in automatic tuner that does a conservative version of the above while you make coffee. They are genuinely useful, and they are also where the vendor-versus-third-party comparison gets interesting, because the built-in tools trade control for convenience in ways worth understanding before you trust one.
NVIDIA App automatic tuning
The NVIDIA App — which absorbed the old GeForce Experience overlay after the classic Control Panel was retired — has a Performance panel with an Enable automatic tuning switch. It runs a scan (roughly 10-20 minutes) that probes your specific card's stability and builds a safe V/F offset, typically netting +3-5% on average. NVIDIA is explicit that this does not void your warranty. It is the single best starting point for a nervous first-timer: it will not let you set something the card cannot survive, and you can still open Afterburner afterward to push further manually. The catch is that “safe” means conservative — it leaves headroom on the table that a patient manual tune will find.
AMD Adrenalin Performance and Tuning (and the +10% cap)
Radeon users get the equivalent in Adrenalin's Performance → Tuning menus, with both an automatic profile and full manual controls including a voltage offset in millivolts — AMD's tuning culture leans toward undervolting to overclock, lowering voltage so the card runs cooler and boosts higher within the same power budget. One important 2026 caveat: on RDNA 4 (the RX 9000 series) the Adrenalin power limit slider is hard-capped at +10%. So when a guide recommends +12% for AMD, understand that it is describing older cards or third-party tools — the stock Adrenalin slider on a current Radeon will not go there. That is a concrete example of why there is no single universal safe setting across vendors.
Auto versus manual: what you give up
Automatic tuning is strictly worse at finding your card's true ceiling and strictly better at not requiring your attention. It cannot tune core and memory independently the way you can, it will not chase the last few percent, and it does not teach you where your card's limits are. Manual tuning in Afterburner gives you independent core and memory control, five saved profiles, a custom fan curve, and cross-vendor consistency if you switch cards. The honest recommendation: run the automatic tuner first to get a safe baseline and a feel for your card's temperament, then decide whether the extra 3-5% from a manual pass is worth your evening. For many people running a stable emulation rig, the auto tune is genuinely enough.
The Memory Trap: When Faster Is Slower
If you remember one thing from this guide, make it this section, because memory overclocking breaks the intuition that governs everything else. With the core clock, instability announces itself: a crash, a reset, a screen full of colored triangles. With memory, the card lies to you politely for a long time before it ever shows a symptom, and if you tune by feel you will end up with an overclock that is perfectly “stable” and measurably slower than stock.
GDDR “error correction” is really retransmission
Modern GDDR does not use the halting parity errors of old system RAM. Its error handling is closer to detection and retransmission: when the memory controller receives data whose checksum does not validate, it discards it and asks for it again, exactly the way Ethernet or Wi-Fi recovers a corrupted packet. As documented across years of Tom's Hardware overclocking discussion, the corrections are handled invisibly. So the first symptom of too-high memory is not an artifact — it is FPS that stops rising and then begins to fall as you keep clocking up, because every retransmission is wasted bandwidth. Artifacts and crashes only appear much later, when the error rate finally overwhelms the correction. There is a wide band where the card is unstable, slower, and showing you nothing.
How to find the real sweet spot
This is why memory is a step you tune with a benchmark score, not your eyes. Raise the memory clock, run a scored loop, and record the number. As long as the score climbs, keep going. The moment the score plateaus or dips — even by a percent, even with a clean-looking screen — you have crossed the sweet spot. Step back to the last clock that produced your best score. That value, not the highest clock that avoided artifacts, is your real maximum. A card with only 12GB of VRAM like the RTX 5070 makes this doubly worth doing right, because in memory-bound situations every genuinely-effective megahertz of bandwidth counts — and a memory overclock that is silently spending bandwidth on retransmissions is the opposite of what you wanted.
Expected output: passing versus failing
OCCT's dedicated VRAM test will surface the errors the benchmark score only hints at. Here is what the two ends of the spectrum look like — a clean run, and the three signatures of a memory (or core) overclock that has gone too far:
# CLEAN — OCCT VRAM test, 20 min, memory at the score-peak clock
[VRAM] 0 errors after 20:00 — sweet spot confirmed, lock it in

# TOO FAR (1) — OCCT catches errors the screen never showed
[VRAM] Error detected @ 0x1F4A9C0... corrected  <- back the memory clock DOWN

# TOO FAR (2) — Windows, Event Viewer > System (the classic driver reset)
Display driver nvlddmkm stopped responding and has successfully recovered.
  Source: Display   Event ID: 4101   <- TDR: usually the CORE clock, not memory

# TOO FAR (3) — Linux, dmesg after a hang
amdgpu 0000:03:00.0: amdgpu: GPU reset begin!   <- SCLK/voltage unstable
[drm] GPU reset(3) succeeded!
Learn to tell these apart. A TDR (Timeout Detection and Recovery) event or a black-screen-then-recover almost always means the core clock is too high. VRAM errors in OCCT with no crash, or a benchmark score that fell, mean the memory is past its sweet spot. Chasing the wrong one is the most common way people waste an evening.
Five Pitfalls That Cost You a Weekend
Everything above assumes you avoid the classic mistakes. These are the five that turn a one-hour tune into a Saturday of confused re-testing, grouped by the kind of error they are.
Thermal and power mistakes
Pitfall 1 — chasing clocks before raising the ceilings. If you add a core offset while the power limit is still stock, the boost algorithm hits the power wall and throttles, and you conclude your card “can't overclock.” It can; you just never gave it the budget. Always max power and temperature limits first, then re-benchmark, then touch clocks. Pitfall 2 — ignoring the hotspot and memory-junction temperatures. The core temperature might read a comfortable 72°C while the hotspot sensor sits at 95°C and the memory junction is hotter still. On many cards it is the memory junction that throttles first under a heavy memory overclock. Monitor all the sensors GPU-Z exposes, not just the headline core number, and build your fan curve around the hottest one.
Stability and validation mistakes
Pitfall 3 — testing too briefly. A ten-minute pass proves nothing about a two-hour emulation session; thermal saturation and rare instability both take time to appear. Short loops are for quickly rejecting bad settings, not for blessing good ones — validate your final overclock with a 30-to-60-minute run and then the real workload. YouTube's popular “+20 MHz, test for 10-15 minutes” advice is fine for the adjustment size but too short on validation to trust for a daily driver. Pitfall 4 — tuning core and memory at the same time. If you move both and it crashes, you have no idea which one broke. Lock the core completely, validate it, and only then start on memory. One variable at a time is not pedantry; it is the only way the crash tells you anything useful.
Persistence mistakes
Pitfall 5 — forgetting to make it stick, or making it stick too aggressively. Two failure modes here. The first: you tune a great overclock, never save it to a profile slot, never enable Apply overclocking at system startup, and it silently reverts on the next reboot — leaving you to wonder why last night's stable settings are gone. The second, less obvious: you save an overclock that was only validated at low ambient temperature, and it becomes unstable on a hot afternoon when your room is five degrees warmer. Leave a small safety margin below your absolute maximum specifically so a warm day does not turn your saved profile into a crash-on-boot. The last stable clock in January is not always the last stable clock in July.
Troubleshooting: Symptom, Cause, Fix
When an overclock misbehaves, the symptom usually points straight at the cause once you know the map. Read the tell, apply the fix, re-validate. This table covers the failures you will actually hit.
How to read the table
The pattern to internalize: core-clock instability is loud and immediate (crashes, driver resets, artifacts), while memory instability is quiet and gradual (falling scores, corrected VRAM errors) until it finally isn't. Power and thermal problems present as clocks that sag under load rather than crash. Match your symptom to the right column before you touch a slider.
The table
| Symptom | Likely cause | Fix |
|---|---|---|
| Black screen, then “driver stopped responding and recovered” | Core clock too high (TDR event) | Drop core offset 30-45 MHz below the crash point; re-test |
| Benchmark score climbs, then falls as you raise memory | GDDR error correction / retransmission | Back memory off to the last clock where the score improved |
| Colored dots, flickering textures, geometry spikes | Memory clock unstable (true artifacts) | Reduce memory 60-120 MHz effective; re-run OCCT VRAM test |
| Game crashes to desktop under load, no artifacts | Power limit too low, or core slightly high | Max the power limit first; if it persists, lower core one step |
| Clocks sag and temps sit at 85-90°C | Thermal throttle | Steeper fan curve (100% by 85°C), improve airflow, repaste if old |
| Overclock gone after reboot | Profile not applied at startup | Save to slot 1-5, enable “Apply overclocking at system startup” |
| Whole PC reboots or powers off under FurMark | PSU can't hold transient spikes | Lower power limit, check PSU wattage and PCIe cables, don't run FurMark uncapped |
| Auto-tune finishes but gains are tiny (+2-3%) | Card already near its thermal/power limit | Improve cooling and retry, or accept it — that may be the ceiling |
| AMD power-limit slider stops at +10% | RDNA 4 hard cap in Adrenalin | Expected behavior; use undervolt-to-overclock instead of more power |
| Stable in Superposition, crashes in the emulator | Synthetic load ≠ real shader/upscale load | Validate with the actual workload; back off one increment |
Reading the crash logs
On Windows, the ground truth is Event Viewer → Windows Logs → System, filtered for source Display and Event ID 4101 — that is the TDR, and its timestamp tells you exactly which test triggered it. On Linux, dmesg after a hang shows the amdgpu or nvidia reset lines quoted in the previous section. Do not troubleshoot by vibes: the logs distinguish a driver timeout (core) from a memory error (memory) from a hard power event (PSU), and each has a different fix. Guessing wastes the evening; reading the log ends the investigation.
Advanced: BIOS, V/F Curves, and Linux
Software sliders are where sane people stop. Past them lies a tier of techniques with better ceilings and considerably worse failure modes — the domain of enthusiasts who have accepted that the reward is a few extra percent and the risk is a paperweight. Presented for completeness, with the warnings intact.
BIOS flashing and TDP targets
When the VBIOS power limit itself is the wall, the enthusiast answer is to flash a modified BIOS with a higher power ceiling. A 2026 BIOS-level guide describes raising the GPU's TDP target by 10% initially, increasing another 5% if stable, and setting the TDP maximum 10-15% above the target — then validating with a 30-minute FurMark or demanding-game stress test, plus memory validation and a performance check in the actual target workload. This is real, it works, and it is genuinely dangerous: a bad flash can brick the card, and it voids your warranty in a way software tuning never does. Two rules if you insist. First, back up the stock VBIOS with GPU-Z before you write anything. Second, prefer cards with a dual-BIOS switch, so a failed flash on one ROM leaves you a working one to boot from and recover. If neither of those sentences was comfortable, this is your sign to stay on the sliders.
The V/F curve: undervolt to overclock
The most rewarding advanced technique is also the safest, and it is the opposite of brute force. Afterburner's voltage-frequency curve editor (much improved in the 4.6.7 beta) lets you pin a specific frequency to a lower voltage, so the card hits your target clock while drawing less power and running cooler — which, because boost is power- and thermal-gated, often lets it sustain that clock more consistently than a raw offset would. This is the same philosophy as undervolting a CPU: efficiency as a performance strategy. On a thermally-constrained card — a laptop, a small case, a hot summer room — a flat undervolt at a modest clock frequently beats an aggressive offset that spends its afternoon throttling. It takes longer to dial in than a slider, but it is the technique that keeps giving on the exact hardware where sliders disappoint.
Linux: nvidia-settings, amdgpu sysfs, and the GUIs
Plenty of emulation rigs run Linux, and overclocking there is entirely possible — it just lives in command-line offsets and kernel parameters instead of a polished UI. On NVIDIA you unlock the offsets with Coolbits, then apply them through nvidia-settings:
# NVIDIA on Linux: unlock clock/fan/power control, then apply offsets
sudo nvidia-xconfig --cool-bits=28        # 28 = clocks + fan + power
# (restart X or reboot for Coolbits to take effect)
nvidia-settings -a '[gpu:0]/GPUGraphicsClockOffsetAllPerformanceLevels=150'
nvidia-settings -a '[gpu:0]/GPUMemoryTransferRateOffsetAllPerformanceLevels=1200'
nvidia-settings -a '[gpu:0]/GPUFanControlState=1'
nvidia-settings -a '[fan:0]/GPUTargetFanSpeed=70'
On AMD the control surface is the kernel's amdgpu driver, exposed through sysfs. You must boot with the feature mask unlocked (amdgpu.ppfeaturemask=0xffffffff on the kernel command line), then write to the overclock table and commit:
# AMD on Linux (RDNA): needs kernel param amdgpu.ppfeaturemask=0xffffffff
echo manual | sudo tee /sys/class/drm/card0/device/power_dpm_force_performance_level
cat /sys/class/drm/card0/device/pp_od_clk_voltage      # read the OD table FIRST
# raise top SCLK state, nudge MCLK, undervolt, then COMMIT with 'c':
echo 's 1 3250' | sudo tee /sys/class/drm/card0/device/pp_od_clk_voltage
echo 'm 1 1290' | sudo tee /sys/class/drm/card0/device/pp_od_clk_voltage
echo 'vo -50'   | sudo tee /sys/class/drm/card0/device/pp_od_clk_voltage
echo 'c'        | sudo tee /sys/class/drm/card0/device/pp_od_clk_voltage
If raw sysfs writes are not your idea of a good evening, two open-source GUIs wrap all of this: LACT (the Linux AMDGPU Control Application) and CoreCtrl both give you sliders, curves, and per-game profiles on top of the same kernel interface. They are the closest thing Linux has to Afterburner, and for a set-and-forget emulation box they are the sane choice.
The Complete, Stable Configuration
Here is a validated starting configuration to work down from, not a set of numbers to trust on faith. Remember the silicon lottery: these are conservative-to-typical targets you confirm with your own testing, and your card may land a little higher or lower. Treat every value as a hypothesis your benchmark either confirms or rejects.
NVIDIA and AMD starting templates
############  STARESBACK.GG — validated OC starting profile  ############
# STARTING targets to validate, NOT guaranteed-stable numbers.
# Silicon lottery is real: every card lands a little different.

## NVIDIA (RTX 50-series, Afterburner 4.6.6) --------------------------
Power Limit ........ +15%  (or max slider)      # raise FIRST
Temp Limit ......... 87 C  (link/raise if unlocked)
Core Clock ......... +150 MHz   (validated DOWN from first crash)
Memory Clock ....... +1200 MHz effective        # stop at the SCORE peak
Voltage ............ +0 mV  (unlock monitoring; leave stock unless V/F)
Fan Curve .......... 100% by 85 C (see below)
Profile Slot ....... 1
Apply at startup ... ON

## AMD (RX 9000, RDNA 4, Adrenalin) ----------------------------------
Power Limit ........ +10%  (HARD CAP in Adrenalin — expected)
Voltage Offset ..... -50 mV  (undervolt-to-overclock)
Max Frequency ...... +300 MHz  (community runs ~+350; validate down)
Fast Timing ........ ON, then memory OC in small steps to the score peak
Fan ................ aggressive; keep hotspot comfortably under throttle

## Fan curve (both vendors) ------------------------------------------
40C=30%   55C=40%   65C=55%   75C=75%   80C=90%   85C=100%
Make it persist
The configuration is worthless if it does not survive a reboot. In Afterburner, click the numbered profile slot (1-5) with your settings loaded to save them, then open Settings → General and enable Apply overclocking at system startup — and, if you want it live before login, the associated startup service. Confirm it works by rebooting and checking that GPU-Z shows your offsets applied at idle. On Linux, wrap the nvidia-settings or sysfs commands in a systemd service or a startup script so they re-apply on boot; the GUIs (LACT, CoreCtrl) handle this for you with a checkbox.
The verdict
Overclocking a GPU in 2026 is exactly what the guides say it is — free performance — and exactly not what the word “free” implies, because the currency you spend is time, thermal headroom, and the discipline to measure rather than guess. Done right, you will pull 5-12% out of a card you already own: the margin that locks your heaviest emulation preset to 60 fps instead of watching it stutter. Done wrong, you will spend a weekend chasing a crash whose cause was in the Event Viewer the whole time. Raise the ceilings first, move one variable at a time, watch the score on memory, validate on the real workload, and back off one step for the summer. The card will tell you where its limits are. Your only job is to listen, and to write the numbers down.
Questions the search bar asks me
- Will overclocking void my warranty or kill my card?
- Software overclocking through MSI Afterburner or the NVIDIA App's automatic tuning does not void your warranty and is wiped on reboot, and NVIDIA states its auto-tuner does not affect coverage. Modern cards defend themselves with hard power, thermal, and voltage limits, so a bad software OC crashes or resets the driver rather than dying. Flashing a modified VBIOS is the exception: that voids warranty and can brick the card.
- How much extra performance will I actually get?
- Realistically 5-12% from a validated core-and-memory overclock on most cards; NVIDIA App automatic tuning averages a more conservative +3-5% in a 10-20 minute scan. It is single-digit to low-double-digit free performance, not a jump to the next card up the stack. If you want a bigger leap, that is a hardware upgrade, not a slider.
- Why did my benchmark score go DOWN after I raised the memory clock?
- GDDR memory does not corrupt silently — it detects errors and retransmits the data, exactly like Ethernet or Wi-Fi, which costs performance long before any artifact appears. As Tom's Hardware documents, FPS climbs, then falls as the clock keeps rising, well before crashes start. A falling score IS the signal you have passed the sweet spot; step the memory back to the last score that improved.
- MSI Afterburner or the vendor's own tool — which should I use?
- Use Afterburner 4.6.6 (stable) for granular manual control, five profile slots, a custom fan curve, and cross-vendor support. Use the NVIDIA App or AMD Adrenalin for a one-click automatic tune when you do not want to babysit it. The 4.6.7 build is still beta 3 (build 17352) as of mid-2026 — grab it from MSI or Guru3D only if you specifically want the new V/F curve tools.
- Should I raise the core clock or the power limit first?
- Power and temperature limit first — max the sliders before you touch a clock. Boost is power-gated, so a card pinned at 100% of its stock power budget throttles before your core offset ever matters; raising the ceiling is what lets the offset do anything. Tom's Hardware's guide runs the same order: max power and temp, then core in +15 MHz steps, then memory.
Marcus covers the gaming PC, GPU, and peripheral side of staresback. Every post under this byline is reviewed pre-publish by Sam P., Editor & Operator — corrections to info@instalinkoteam.com. Published 2026-08-29 · Last updated 2026-08-29. Full bios on the author page.